
Dauphin County Monthly Market Update
Check out the latest information on how the real estate market is doing in Dauphin County.
Monthly Market Update - October 2021
We hear all the time from buyers that they want to put their home buying process on hold until this real estate bubble bursts. So I want to clarify some things. We are not in a bubble. Home prices are rising mainly due to supply and demand. Let me explain.
In October there were 367 Active listings. This number is down from 372 in September. In Oct of 2020, there were 333 active listings. The 5 year Average for Available homes for sale in the month of Oct is 813. That is an astounding 55% decline in the avg number of homes for sale. Supply shortage along with high demand due to increased savings accounts, low-interest rates, and increase in profits from the stock markets.
There were a total of 411 homes that hit the market. Up 2% from September of 2021 but down 2.6% from Oct of 2020. From 422 to 411 (these may be graphics). We have been pretty close to the 5 year average for the month of Oct at 400 homes.
The total number of homes pending was 401. Up 1.3% from September and down 2.9% from October of last year. This number is well above our 5 year average of 348.
The number of Closed Sales is up almost 4% from 356 in September to 369. Closed sales from October of last year are the exact same.
Let’s talk a little about pricing.
The Median Sales price is up 3% from September. However, from October of 2020, it is up a whopping 16% from October of last year to $210,900. Year to date the median sold price is $201,00 up 13.8% from 2020. The 5 year average for Oct is $175,580.
If you’re in the market right now, you know how quickly homes are going under contract. The average number of days on market is 22 days, down from 27 this time last year.
These days when a home is priced right, the asking price is the starting price. In September, the average sold price to the original listing price was 100.3%. October of last year this was 99.1%. The 5-year average is 96.8%
Below you will our real estate market snapshot with information on how the market has performed over the past 30 days in Dauphin County.
Any questions that you may have, feel free to contact us. We're happy to help in any way that we can.
Market Trends
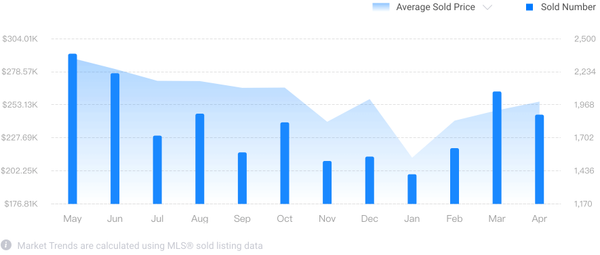
Check Home values in your area over 12 months.
Unlock Local Market Trends

Filters Reset
Save Snapshot
View Results
MARKET SNAPSHOT
(JUL 04, 2026 - AUG 03, 2026)
MARKET SNAPSHOT
?
Sold Listings
?
Average Sales Price
?
Average Days on Market

(717) 400-1041